
Market Commentary: What Does the Dow Jones Point Drop Mean For Investors?
Wednesday, August 14th marked the fourth-largest point drop in Dow Jones history and was the worst day for the markets so far this year, as the Dow Jones Industrial average tumbled 800 points. It is important to keep in mind, though, that from a percentage standpoint, this kind of decline happens almost three times a year on average. Therefore, this decline is not as unusual as it may seem. And if you’re like most investors, you probably want to know what caused it.
There were two primary culprits driving this decline:
- Weak global growth; and
- Inversion of the U.S. yield curve.
The development of these conditions has caused some investors to worry that we are entering a global recession. Let’s analyze both topics listed above and determine if those fears are warranted.
Weak Global Growth
Trade wars between the U.S. and China, as well as others, have reduced global trade and led to weak global growth. Germany, China and the U.K. all came out with weak economic data within a few days of one another. These reports were released following a trend of already declining global growth. Each one of these countries relies on exports, and in turn, recent trade wars have hit them hard. When talks between President Trump and President Xi returned to escalation instead of a deal, it stoked fears that this already weak data would slide into a full-blown global recession. This fear will cause investors to become more reluctant to invest in countries they consider high risk and to seek out safer assets. It should be noted that markets did rally when it was announced that there would be a delay until December 15th on import taxes levied on consumer goods, such as iPhone, laptops and video games.
Inversion of the U.S. Yield Curve
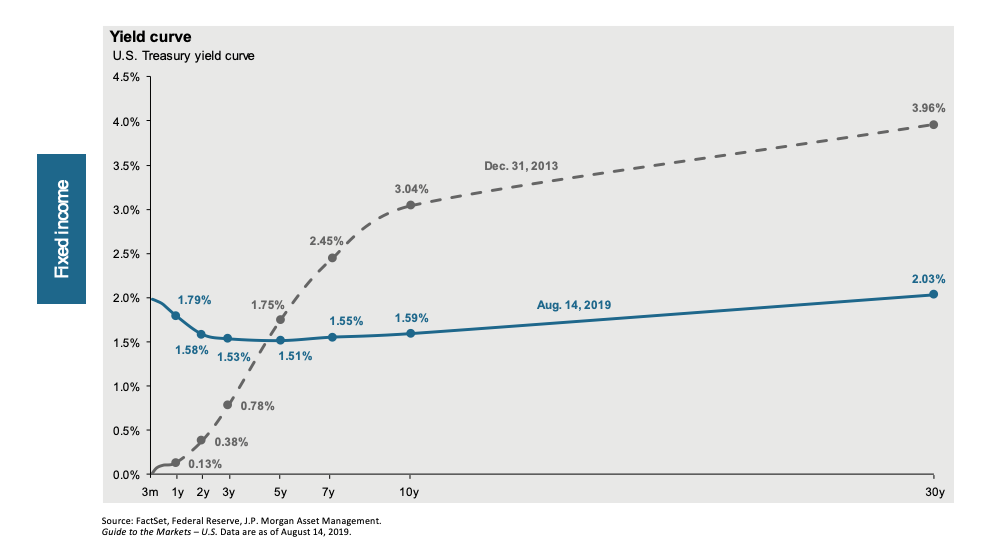
Investors’ search for safer assets leads us to our final point about an inverted yield curve. First, what is an inverted yield curve, and why do we care? Typically, when investors purchase a U.S. treasury bond, they are effectively loaning the government money. The longer they are willing to loan that money, the more interest income they are paid. When the yield curve inverts, investors are paid more for loaning money for less time, effectively turning this relationship on its head (see below for comparison between a typical yield curve and our current one). Officially, this occurs when the ten-year treasury note yields less than the two-year treasury note. There are typically two reasons this happens:
- The short end of the curve rises, often because the Federal Reserve is raising interest rates to manage inflation; or
- The long end of the curve drops due to high investor demand for safe treasuries, which could signal low growth expectations and weak economic data.
Aggressive Fed rate hikes, coupled with already weak data, frequently leads to a recession. This inversion is such a strong indicator that it has preceded 7 of the last 10 recessions just 12-24 months before they happened.
 That means we are going to have a recession soon, right? Well, maybe not. In addition to no single indicator ever being 100% accurate, there are some additional items that cast doubt on the yield curve’s reliability this time around.
- First, the Fed did tighten rates for a short period (a path it reversed in July 2019), but rates started so low, and the Fed tightened rates so slowly that we never reached an interest rate that would be considered restrictive. The Fed’s long-term average effective funds rate is just north of around 4.5%. This time around, it topped out at just 2.5% and has already dropped back down to 2.25%.
- Second, over the course of many years, the Fed enacted a treasury and mortgage bond-buying program to drive long-term rates down. This decision led to a flatter-than-usual yield curve before any slowing in economic growth began. In addition, weakness abroad has led many countries to offer either no interest or even negative interest on their bonds. People have been flocking to U.S. debt for their higher relative rates and better economic status. This extra demand is likely what is driving down long-term rates. In summary, it may be the relative strength of the U.S. economy, and not its weakness, which caused such a sharp drop in long-term rates. These factors muddy the waters on what is typically a clear signal.
What should you, the investor, do? At Waverly Advisors, we strive to have highly-diversified portfolios that are built to withstand the tests of time. In addition, we have positioned our fixed income defensively to help account for the volatility in interest rates. We also hire managers with some of the best track records and expertise within each of their respective asset classes, as well as strategically allocating to broad market index investments. Therefore, as our client, your portfolio is built with anticipation of turbulence. There will still be good days and bad days. The most important thing you can do is to talk with your Waverly Advisors and make sure you are in the right allocation for your particular situation. In the end, the investors with the most perseverance and patience will usually see the best results.
Joshua Miller serves as Senior Investment Analyst with Waverly Advisors. Click here to learn more about him or to reach out to him directly.